
Dashboard, Health and Cluster Status
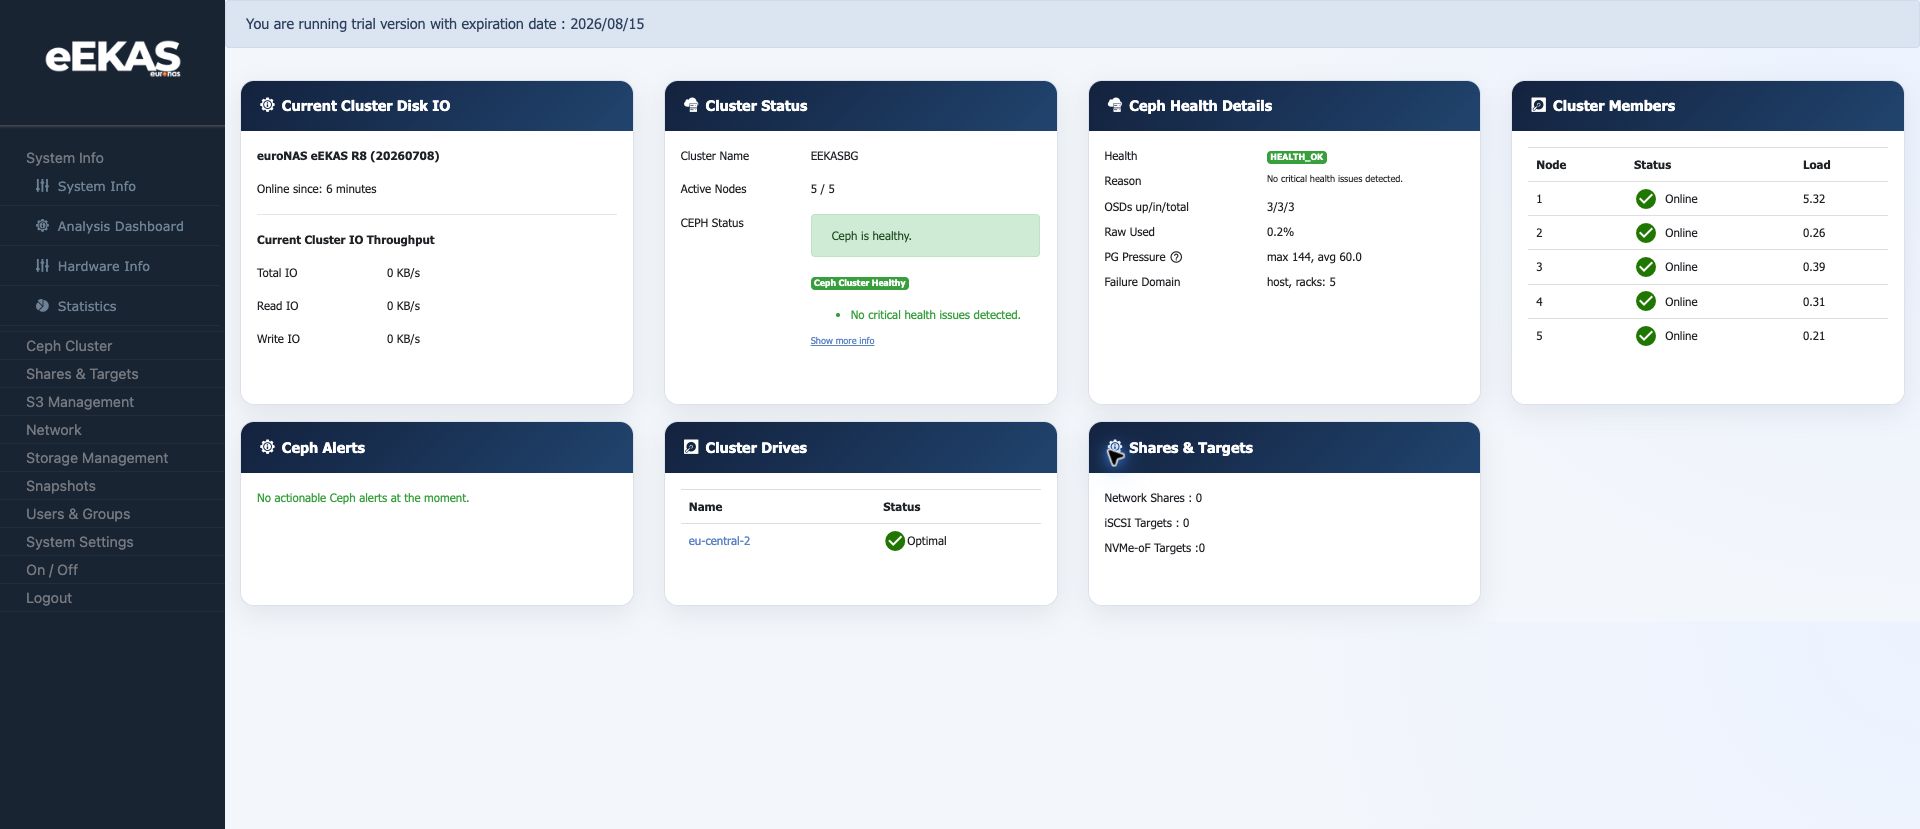
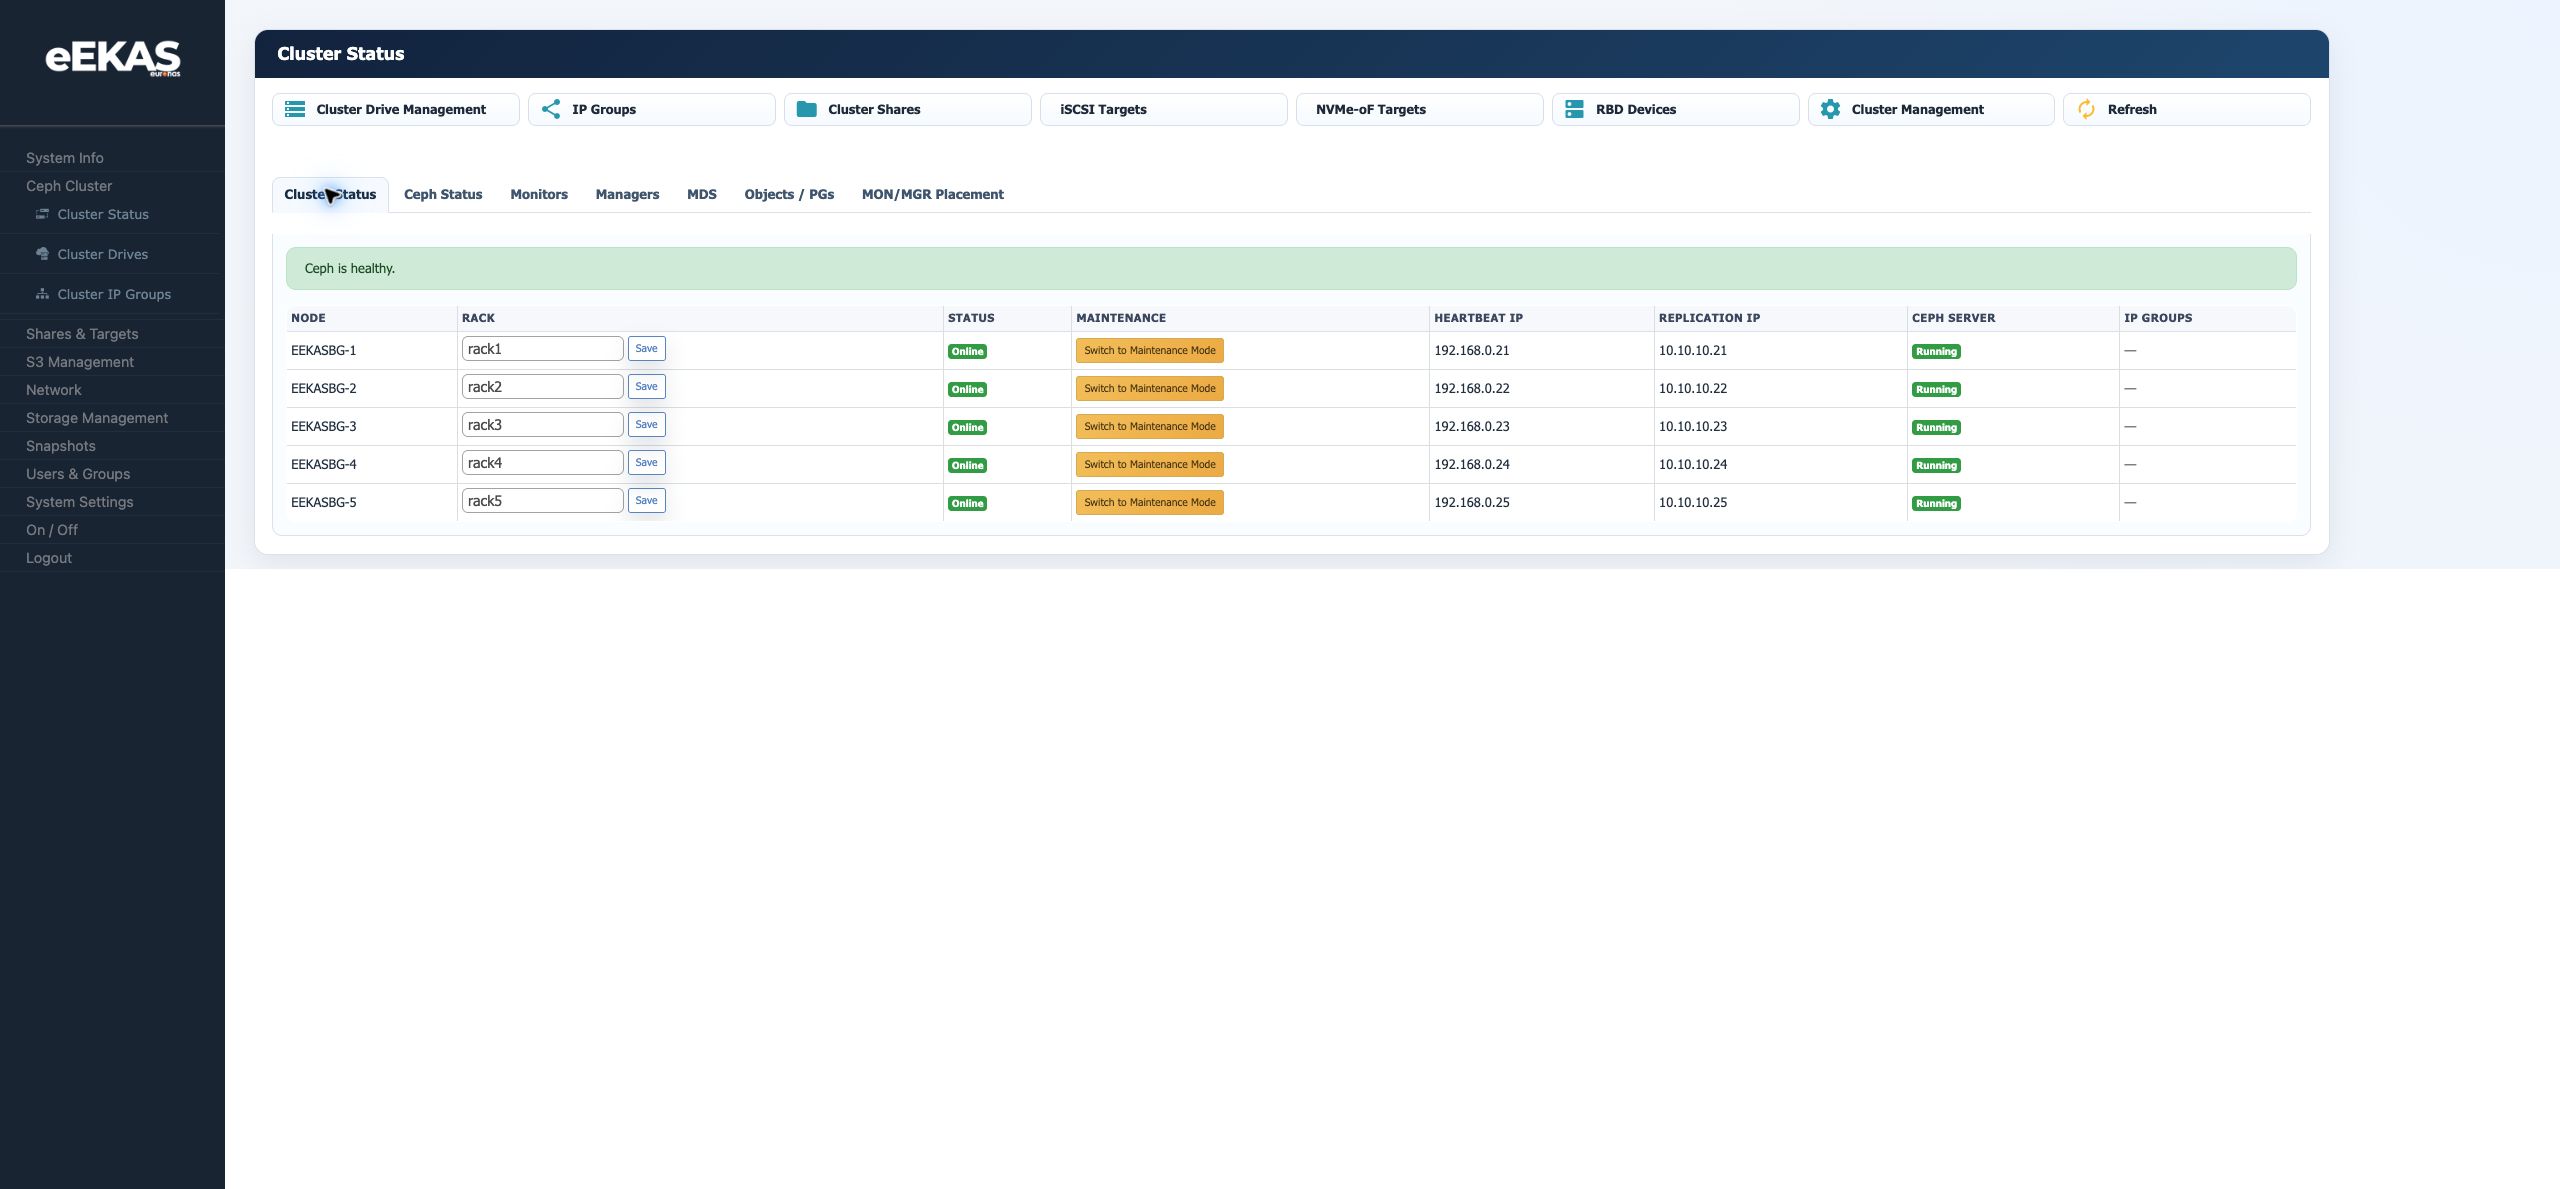
The eEKAS dashboard isand Cluster Status view are the first operational viewviews administrators should check after login. ItTogether combinesthey show system runtime, cluster health, node availability, Ceph status, cluster drive status and service counts in one place.counts.
What the DashboardCluster Status View Shows
| Area | Meaning |
|---|---|
| Management/heartbeat network used to monitor node availability. | |
| Replication IP | Cluster |
| Ceph |
|
| Ceph | services |
Normal Healthy State in the Test Cluster
The test cluster showed five nodes online: EEKASBG-1 through EEKASBG-5. Each node reported Ceph Server as Running. Heartbeat addresses used the 192.168.0.x network and replication addresses used the 10.10.10.x network.
A healthy clusteroperational state should normally show all expected nodes online, Ceph healthhealthy, asCeph healthyServer orrunning HEALTH_OK,on all expected OSDs upnodes and in, no actionableunexpected Cephmaintenance alerts and cluster drives in optimal state.
In the test system the dashboard showed 5 active nodes out of 5 and Ceph reported HEALTH_OK. This is the state administrators should expect before creating shares, targets or S3 services for users.mode.
Daily Operational Check
Use this short check at the beginning of an operational review:
- Confirm that all expected nodes are online.
- Confirm that Ceph is healthy.
- Verify that Ceph Server is Running on each expected node.
- Check
OSDsheartbeatup/in/total.and replication IPs for consistency. - Review
PGwhetherpressureanyandnoderawisusage.in maintenance mode. CheckContinuewhetherwith CephAlertsStatuslistsifactionableanyitems.warning Confirm that cluster drives are optimal.Review service counts for shares and targets.appears.
When to Investigate
Investigate before making configuration changes if onea node is offline, a Ceph Server is not running, a node is unexpectedly in maintenance mode, heartbeat or morereplication nodesIPs are offline,wrong, or Ceph is not healthy, OSDs are not up/in, PG pressure is unexpectedly high, alerts are shown or a cluster drive is no longer optimal.healthy.
Documentation Note
Dashboard and Cluster Status values are point-in-time indicators. For support cases, capture the dashboardpage together with the exact time, affected service and a short description of the observed issue.