
Dashboard, Health and Cluster Status
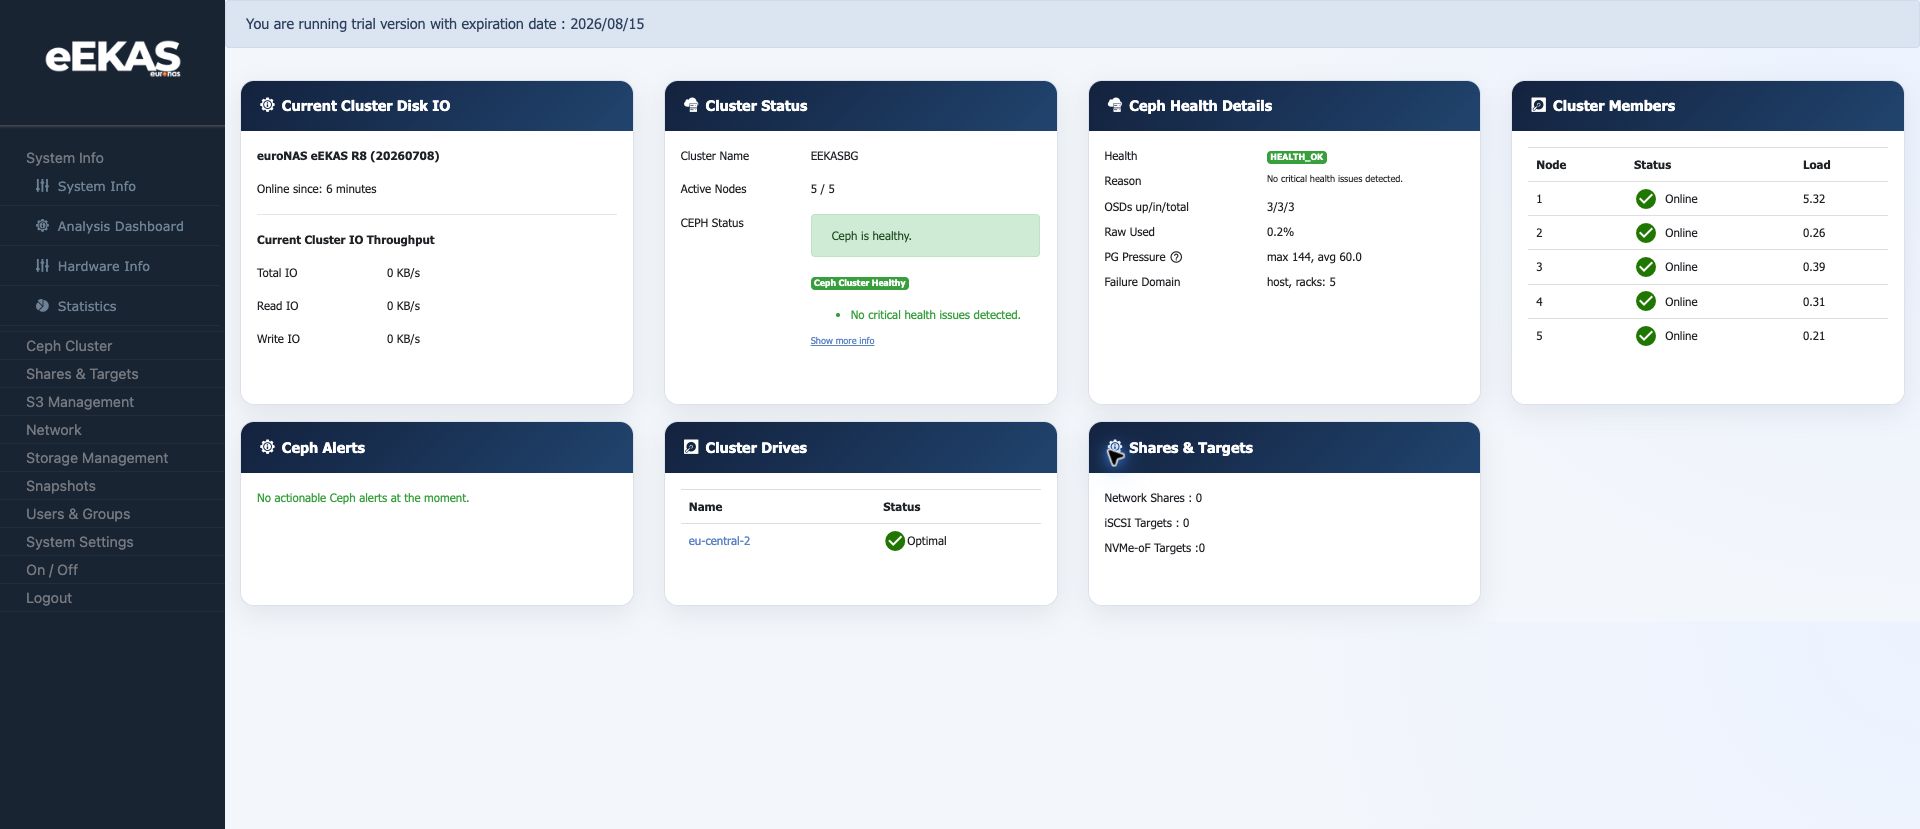
The eEKAS dashboard is the first operational view administrators should check after login. It combines system runtime, cluster health, node availability, Ceph status, cluster drive status and service counts in one place.
What the Dashboard Shows
| Area | Meaning |
|---|---|
| Software version | The installed eEKAS release and build. In the test cluster this was eEKAS R8 (20260708). |
| Online since | Runtime of the current node or appliance session. |
| Current Cluster IO | Current read, write and total cluster throughput. |
| Cluster Status | Cluster name, active nodes and high-level Ceph health. |
| Ceph Health Details | Health state, reason, OSD count, raw usage, PG pressure and failure domain. |
| Cluster Members | Node list with online status and current load. |
| Ceph Alerts | Actionable health warnings, if any exist. |
| Cluster Drives | High-level status of configured cluster drives. |
| Shares & Targets | Counts for network shares, iSCSI targets and NVMe-oF targets. |
Normal Healthy State
A healthy cluster should show all expected nodes online, Ceph health as healthy or HEALTH_OK, all expected OSDs up and in, no actionable Ceph alerts and cluster drives in optimal state.
In the test system the dashboard showed 5 active nodes out of 5 and Ceph reported HEALTH_OK. This is the state administrators should expect before creating shares, targets or S3 services for users.
Daily Operational Check
Use this short check at the beginning of an operational review:
- Confirm that all expected nodes are online.
- Confirm that Ceph is healthy.
- Check OSDs up/in/total.
- Review PG pressure and raw usage.
- Check whether Ceph Alerts lists actionable items.
- Confirm that cluster drives are optimal.
- Review service counts for shares and targets.
When to Investigate
Investigate before making configuration changes if one or more nodes are offline, Ceph is not healthy, OSDs are not up/in, PG pressure is unexpectedly high, alerts are shown or a cluster drive is no longer optimal.
Documentation Note
Dashboard values are point-in-time indicators. For support cases, capture the dashboard together with the exact time, affected service and a short description of the observed issue.